

© Turck Vilant Systems Oy
Turck Vilant Systems Oy, Tekniikantie 4C, 02150 Espoo, Finland
Version history
| Nr | Date | Changes | Author |
|---|---|---|---|
| 0.6 | 17.09.2018 | First draft | HN |
| 0.7 | 26.10.2018 | Update | RA |
| 0.8 | 30.10.2018 | Update (VVM 8.1.1) | RA |
| 0.9 | 6.3.2018 | Minor corrections | MP |
| 0.10 | 18.04.2019 | Draft Document structure adjusted to new VVM release 9.1.1. Details added in multiple section. | SS |
| 0.11 | 25.04.2019 | Minor corrections | MP |
| 0.12 | 2.12.2019 | CSV import documentation added | MP |
| 0.13 | 30.12.2019 | CSV import documentation simplified, since it is now available in the UI. | MP |
| 0.14 | 9.2.2021 | Layout maps and world maps features included | HN |
| 0.15 | 19.5.2021 | Message manage screen shot added | HN |
| 0.16 | 10.9.2021 | Printers section added | HN |
| 0.17 | 14.9.2022 | Location uniqueness emphasized in text | HN |
| 0.18 | 13.3.2023 | Timer & Inventory alerts/subscription | TO |
| 0.19 | 14.6.2023 | Added explaining text to “User permissions” section | TO |
| 0.20 | 01.11.2024 | SSO support explanation, Orders section updated | TO |
| 0.21 | 26.05.2025 | Data model picture outdated | TO |
3.3.5 Reports – Inventory alerts
3.3.6 Reports - Assets exceeding timers
3.4. Layout Maps and World Maps
3.5.2 History - Shipment events
3.5.3 History - Message manager
3.5.4 History - Location events
3.9. Tools menu (Admin functionality)
3.9.9 Email alert subscription
10.1. Server platform installation
10.1.1 Application server and SQL database
10.1.2 Java Runtime Environment
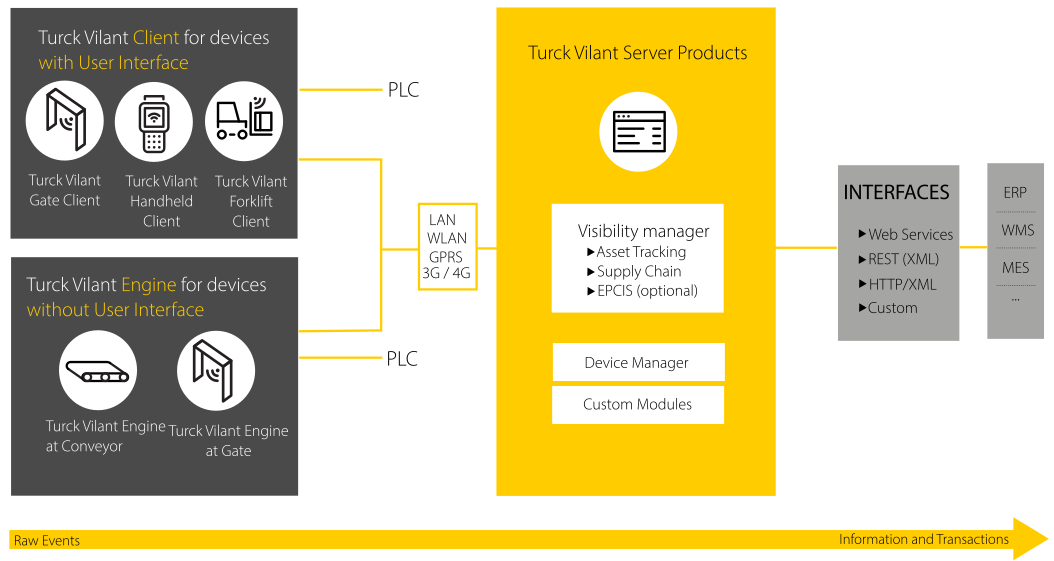
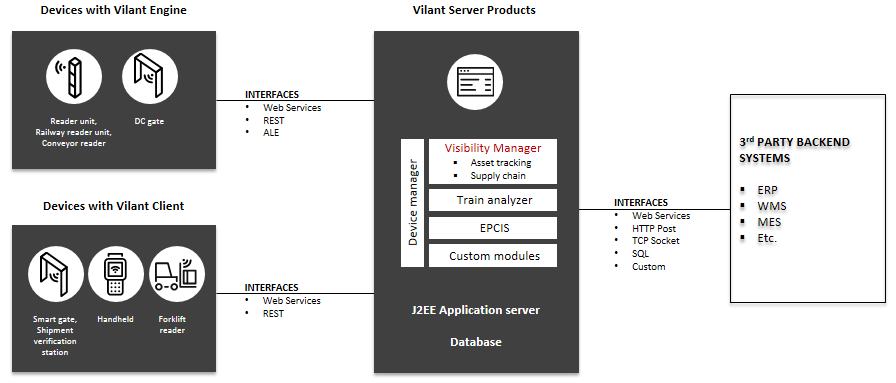
Turck Vilant Visibility Manager (TVVM) is a TVS (Turck Vilant Systems) server solution for RFID based asset tracking, SCM and manufacturing operation traceability and automation. TVVM enables backend integrations and acts as the point for customization for customer business logic – if such is to be carried out in the project.
Asset tracking (RTI and others)
Asset management (Inventory management, rentals etc.)
Warehouse management and operations
Supply chain management
Inbound
Outbound
Intralogistics
Kanban
Manufacturing / production operations
Smart store operations
Smart Cabinet support
TVVM is used to track identifiable items and in TVVM they are called assets. Asset can be any tracked object, such as a pallet, box, item, asset etc. Assets in TVVM have always a defined product type and a unique identifier such as an EPC code (Electronic Product Code) .
Assets can be tracked as induvial assets and they can also belong to a shipment. A shipment is a collection of assets. A shipment can be tracked itself and all assets inside the shipment are moved with the (active) shipments. A shipment tag is an identifier that is assigned to the shipment itself and any events generated for the shipment tag cause an similar event to the (active) shipment and all assets it contains. Shipment tags must always be unique relative to any other assets in the system but they can be reassigned from inactive shipment to new open shipments. An RFID tag assigned to a collection of a pallet as SSCC code for example can be considered a shipment tag in the TVVM system.
Picking operations can be conducted by using the picking lists concept inn TVVM. Picking lists are collections or picking list rows that contain information of certain assets (EPC or External ID) or certain product type that should be picked.
All tracking events are recorded in the events history. Asset can generate asset events and shipment can generate shipment events.
In addition other events, not related to certain assets or shipments, can be tracked as location events by VVM, such as opening of a gate or a door etc.
TVVM is mainly intended to track uniquely identified assets, that have either a RFID tag (UHF, HF, BLE Active tag, etc) or a barcode (or some other form of identified) identified. RFID tag identifier is defined in the EPC (or EPC2) of an asset. Barcodes and other identifiers, such as human readable markings are intended to be stored into the External ID field of an asset.
TVVM does not limit the numbering system of the items, as long as the EPC and External ID fields are unique for each asset. TVVM supports using common GS1 numbering formats for the EPC codes and is able to convert automatically into the GS1 format from EPC hexadecimal format data.
Example of such format would be for example
EPC field of the assets should always contain the EPC code in hexadecimal format. In reports this format can be hidden from users and only GS1 EPC field shown, in case needed.
This chapter includes descriptions on the usage and features of TVVM.
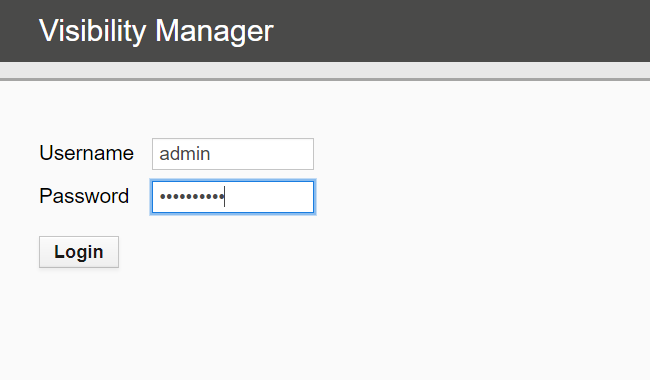
Log-in to TVVM by entering your user credentials on the log-in page.
SSO is supported as custom projects.
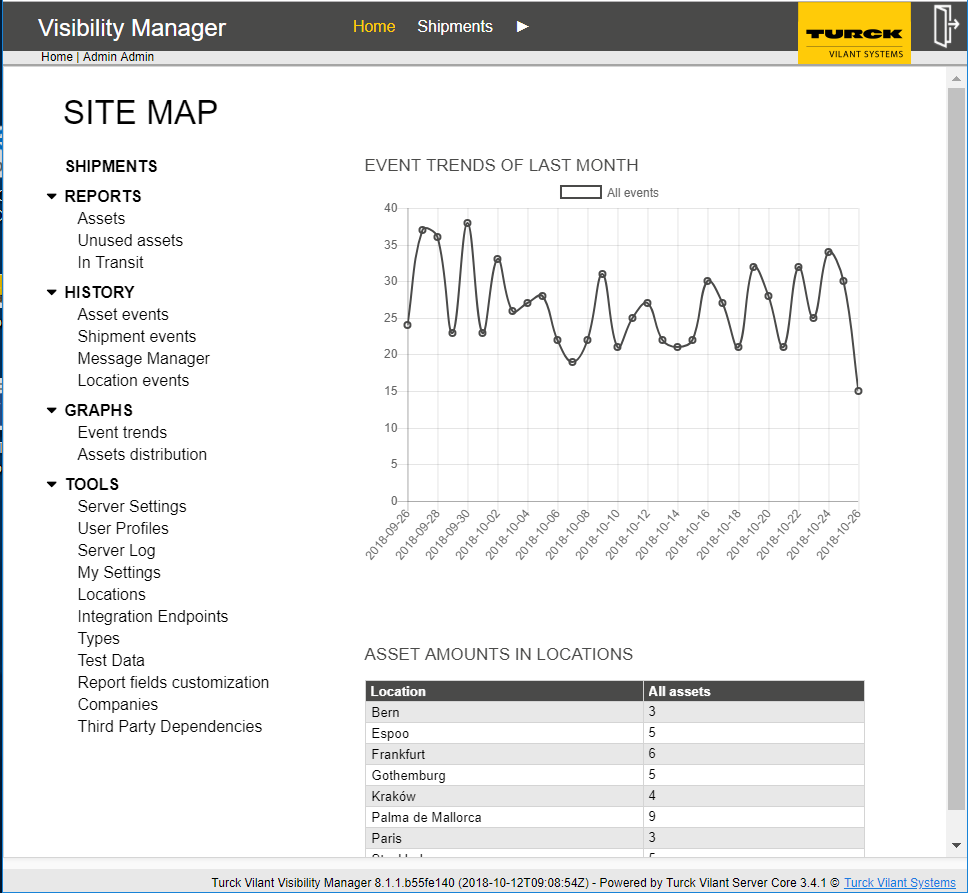
TVVM opens on the main view. The main view consists of the following elements:
Black top bar with menus
Grey top bar with current location on the left and user details and logout functionality on the right
Left table with with shortcuts
Main area with quantity of events per day and quantity of items per location.
You may always return to the main view by clicking the Main menu.
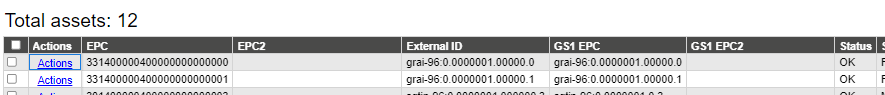
Turck Vilant Visibility Manager contains standard reports for viewing status and details of:
Assets
Events
Shipments
Picking lists
Location events
Inventory
In addition to these standard reports, the TVVM provides an efficient report extension platform for extending these standard reports as well as providing totally new reports.
Typically the reports consists of two sections: top area for search criteria and bottom for displaying the data.
Top of the screen has collapsible search criteria, the searchable criteria varying per report. The search criteria can be expanded or collapsed by pressing the + or – sign in front of the “Search criteria” link.
The bottom of the screen is used to display the data results. The data results area contains summary (typically sum) of the search on the top left corner. On the top right corner of the data results area are function buttons (typically ADD and EXPORT AS CSV).
The data results columns contain an “Actions” column. This column has a menu that allows user to perform additional operations related to this individual row. Examples include: inactivate or move an asset, edit asset parameters, view asset details.
Logout
Search results
Functions
Actions
Search area
Figure 4 – Reports General View
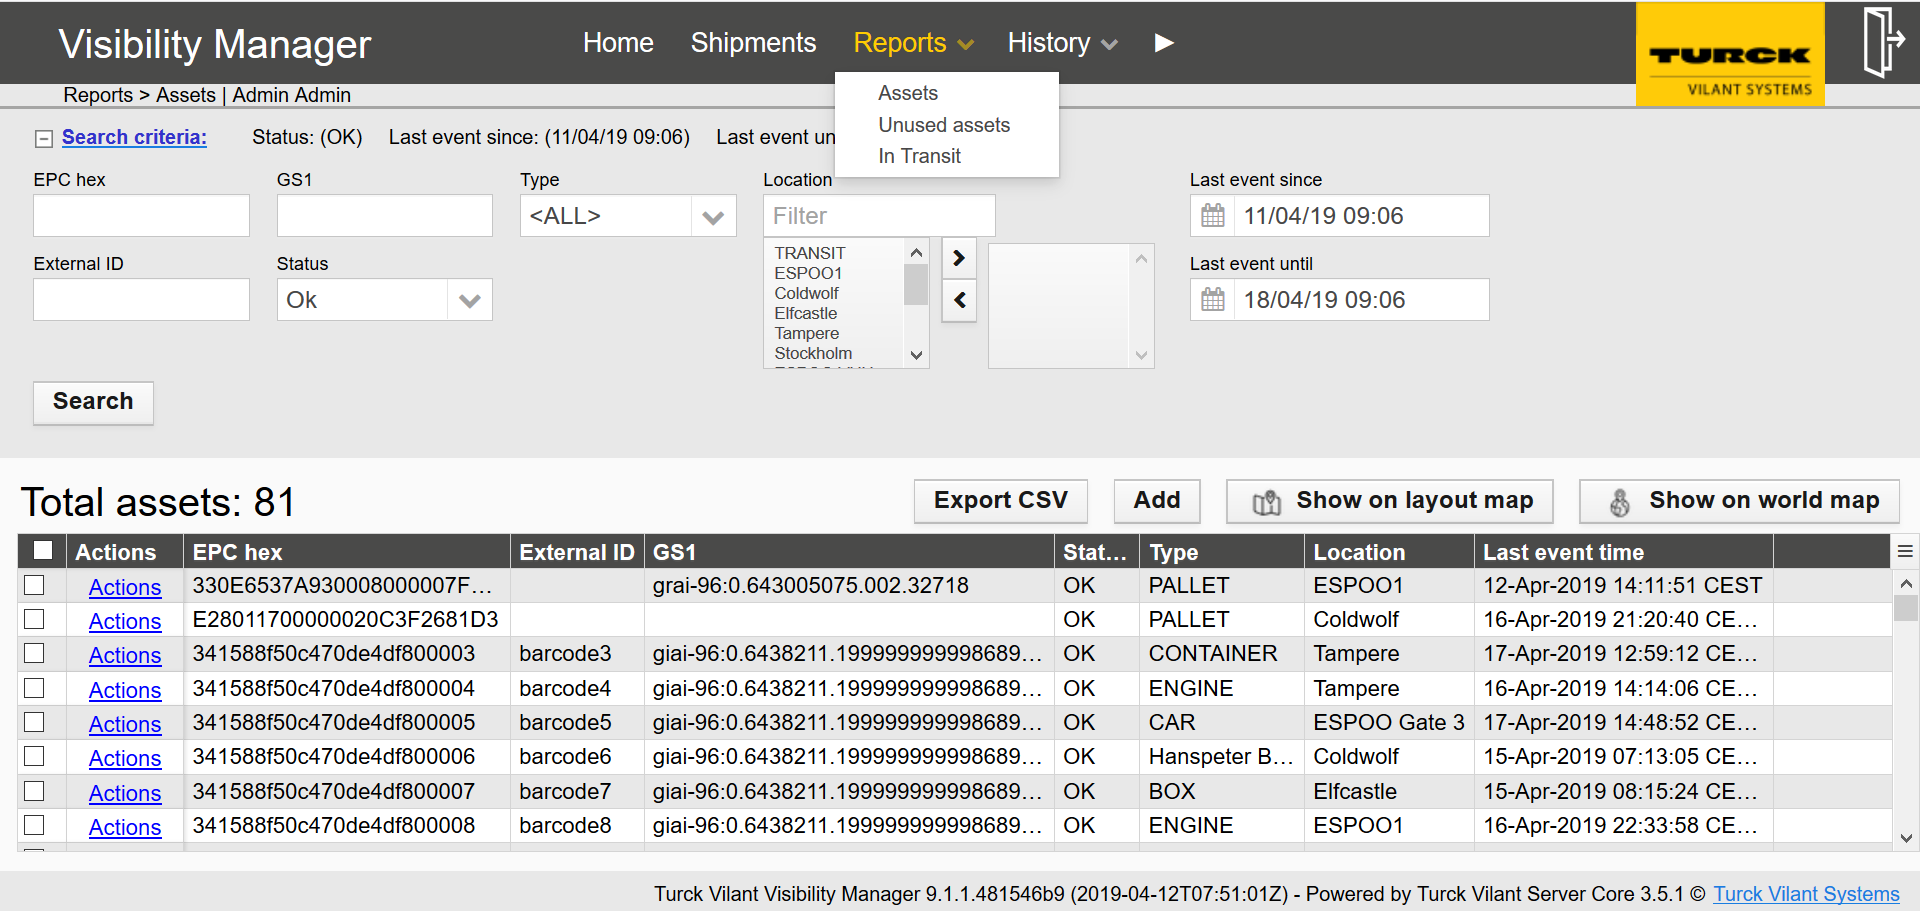
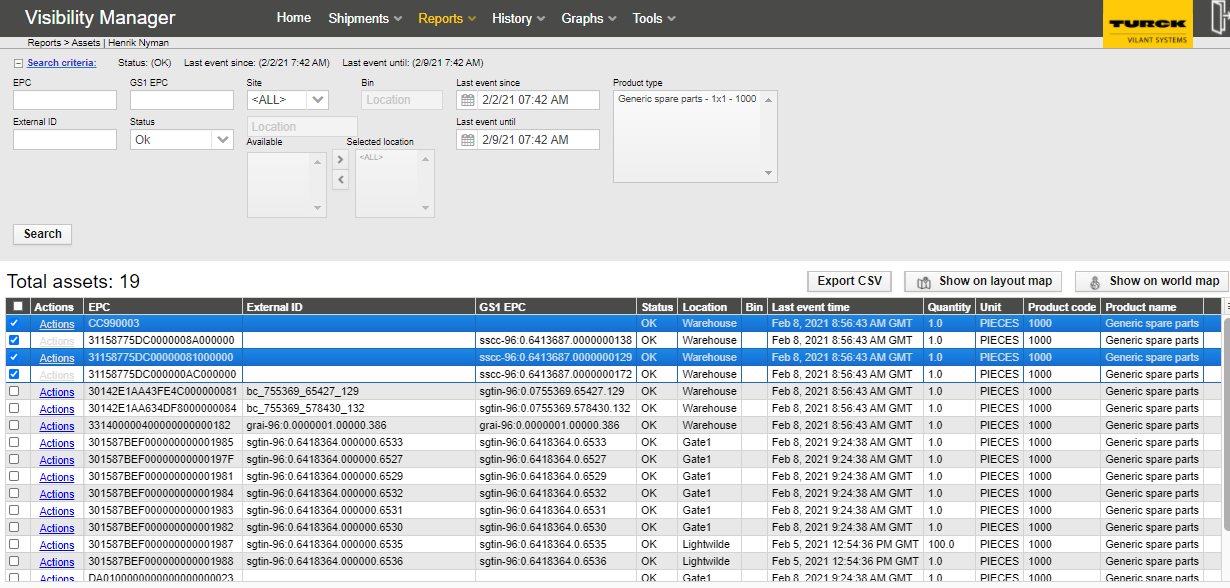
The Assets report can be opened from the black top bar under Reports -> Assets
The inventory report provides a list of assets and their quantity at different locations.
The inventory report has a powerful set of search criteria, enabling it to be used for data mining. The search criteria includes the following:
EPC – Search for a specific asset or shipment based on the EPC code. *,? wildcards are supported.
GS1 EPC presents the EPC code parsed to urn:epc:tag format, if parsing the EPC is possible (i.e. if the tag is encoded in GS1 standard)
External ID –Search for a specific asset or shipment based on the external ID given. *,? wildcards are supported.
Location – The locations in the right-hand side box are used for the search. Add or remove locations to the right-hand side box by choosing one or multiple locations and pressing the arrow keys. You may also filter the visible locations on the left-hand side box by entering filter criteria in to the “Filter locations” box.
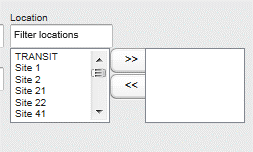
Search applies only to locations selected to this field. (If no locations re selected -> search all locations.)
Figure 6 - Locations
Type – Choose the wanted type from the drop-down menu.
Status – Search for assets or shipments by the status by choosing the status from the drop-down menu.
Last event since / until – Limit the search by date and time by choosing the time limits on the last event since and last event until
After refining your search criteria, the search is executed by pressing the Search button.
Figure 7 – Report Assets
The Unused Assets report can be opened from the black top bar under Reports -> Unused Assets
Figure 8 - Unused Assets Report
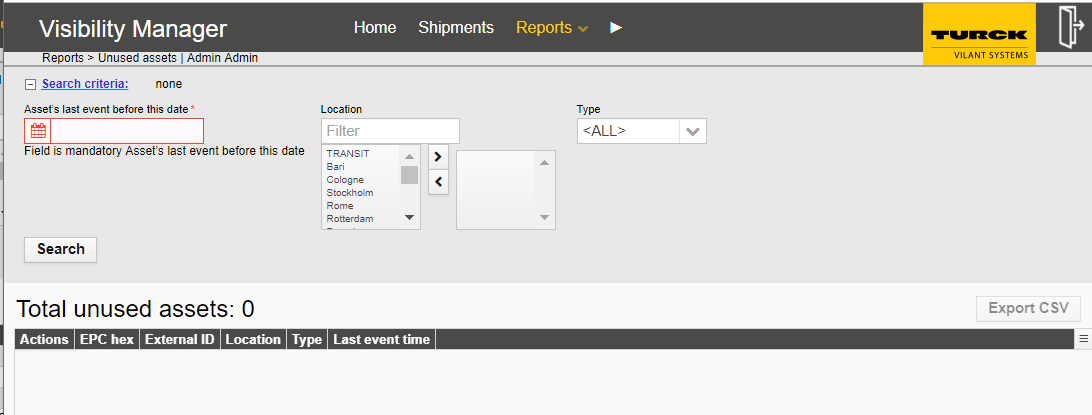
Unused assets report lists assets that have been idle since the user defined point of time.
The report can be used to find assets (and their quantity) that are not used efficiently (or the ones that have been lost altogether).
The timeframe of what is considered as unused asset can be changed from the search criteria.
The report contains the following columns:
EPC – EPC code of the item
External ID – External ID (optional) of the item
Location – Currrent location of the item
Type – Item type
Last event time – Last event for the item
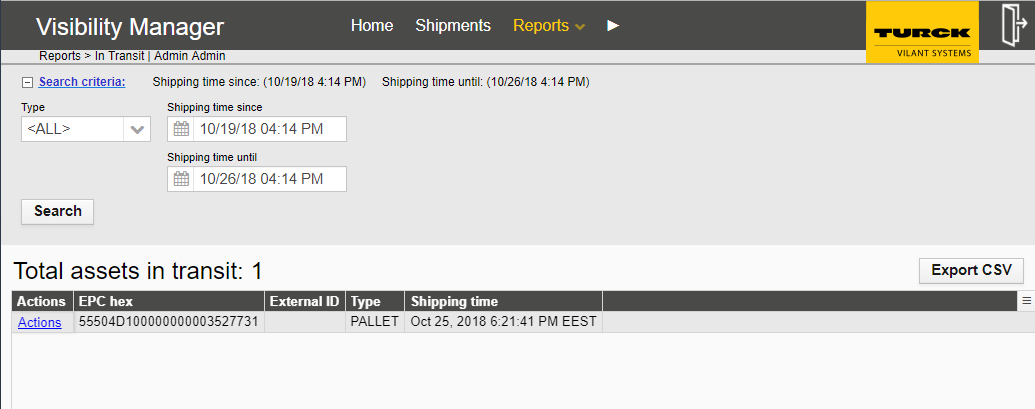
The In Transit report can be opened from the black top bar under Reports -> In Transit
Figure 10 – In Transit Report
In-Transit report shows assets that are not currently in any specific location. (Rather – they are in TRANSIT between locations – e.g. in a truck.)
The in-transit report generates a quick overview of all items that are in transit. Items considered in-transit are ones that have been shipped but have not been received. Depending on the configuration it may be possible that some implementations don’t have in-transit status at all. Please refer to your system administrator to see if this is available.
The search criteria contain the following:
Type – Choose the wanted type from the drop-down menu.
Last event since / until – Limit the search by date and time by choosing the time limits on the last event since and last event until
The report contains the following columns:
EPC – EPC code of the item
External ID – External ID (optional) of the item
Type – Item type
Shipping time – Time stamp when the item was shipped
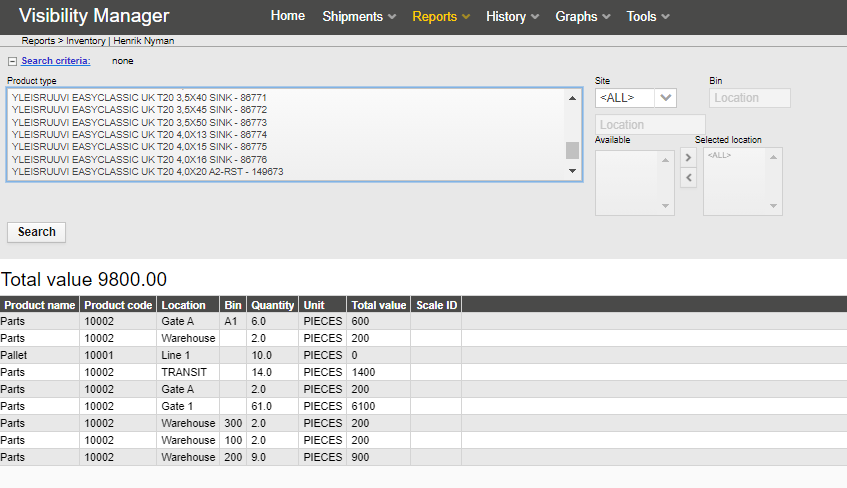
Inventory report is used to show the total number of each product type in certain location, site or in a bin. Inventory report can be used to show the current status and total value of goods in a location.
Report content can be filtered with certain product types and or locations.
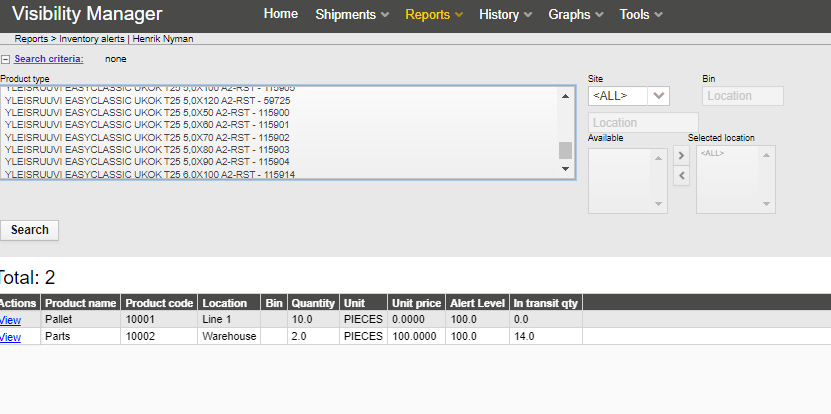
Inventory report is used to show which product types have inventory qty in stock lower than a set alert limit.
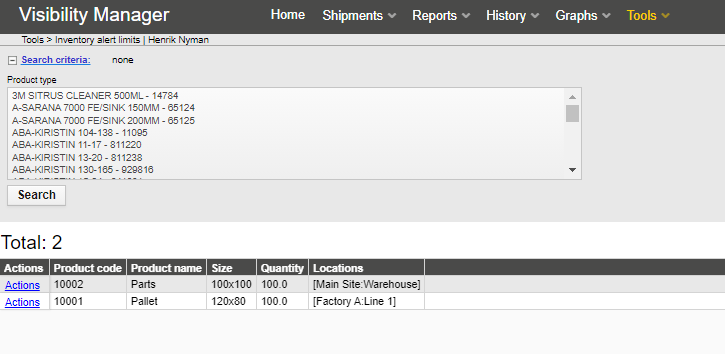
A minimum alert limit level (qty) can be set for each product type in a certain location from the Tools -> Inventory Alert Limits page (accessible only to admin users).
Report content can be filtered with certain product types and or locations.
This report shows assets that have triggered a timer alert.
Timer alerts are configured for a location and asset type combination.
Timer alerts are configured in Tools -> Timer alerts
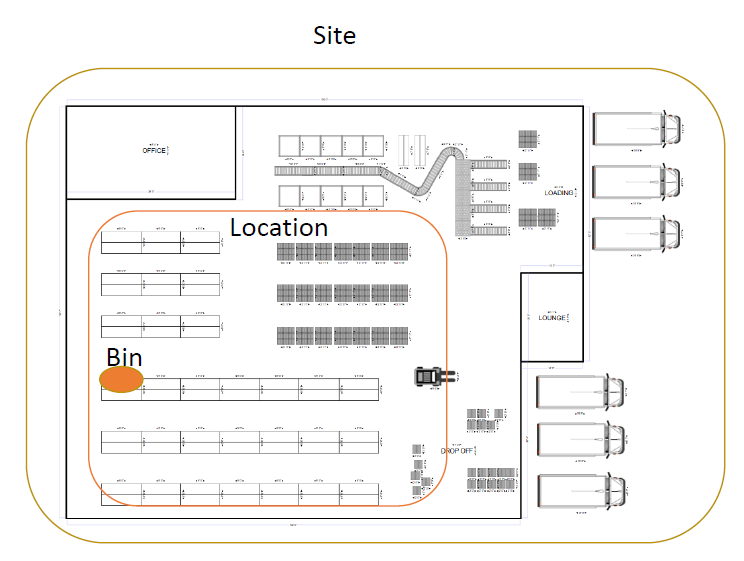
Layout maps feature can be used to show either selected assets (assets report) or events (events report) on a preloaded layout map file (image file).
Step 1: Select assets from main report view, using the checkboxes on the left (or check all from top)
Step 2: Select show on layout map button to display layout map on a popup window
Step 3: Number of assets (in assets report) or events (in events report) shown as circle if the location is defined as x,y coordinates on a layout map. (See Location configurations)
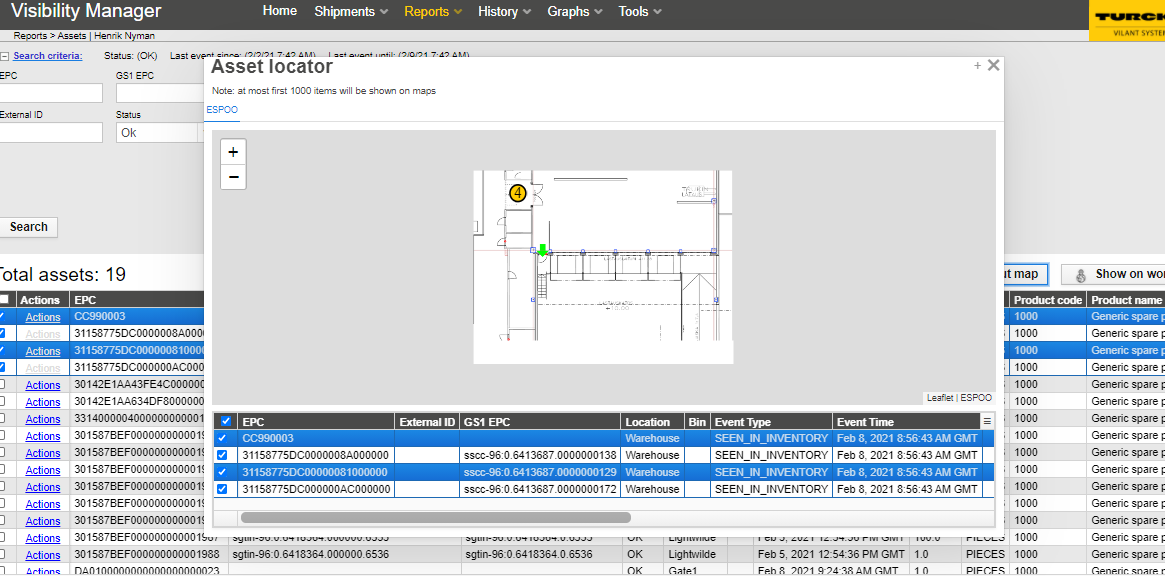
Expand to full screen
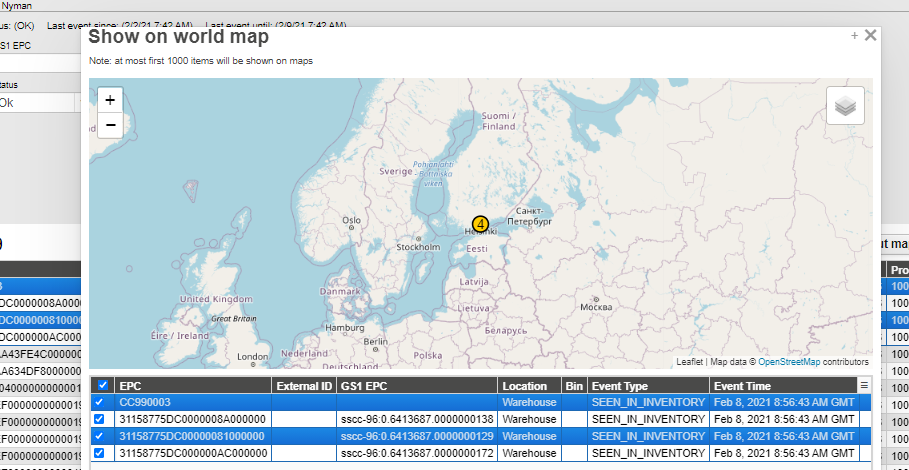
Step 2: Select show on world map button to display world map on a popup window
The history shows the past events of assets, shipments, locations and messaging.
Section History contains multiple history overviews such as
Assets Events
Shipment Events
Message Manager
Location events
The History can be opened from the black top bar
Figure 15 – History menu
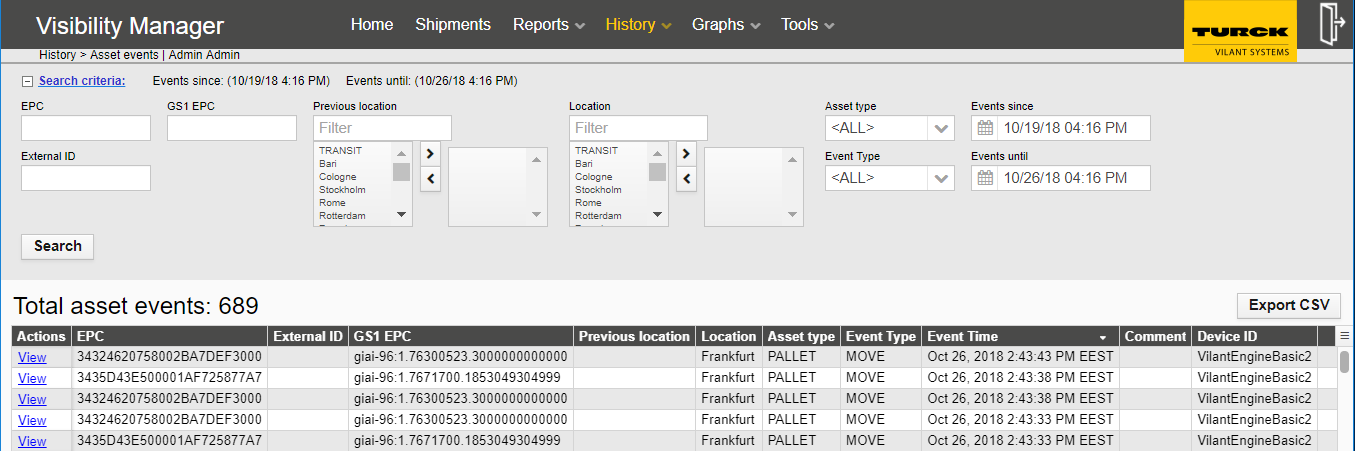
The In Asset Events can be opened from the black top bar under Reports -> Asset events
Figure 16 – Assets events
Assets event report lists full history of all RFID events in the Visibility Manager.
The event history report contains event level data and powerful search criteria for data mining. The report may, for example, be used to see the event history of certain asset types.
The search criteria include the following:
EPC – Search for a specific asset or shipment based on the EPC code. *,? wildcards are supported
External ID – Search for a specific asset or shipment based on the external ID given. *,? wildcards are supported
GS1 EPC presents the EPC code parsed to urn:epc:tag format, if parsing the EPC is possible (i.e. if the tag is encoded in GS1 standard)
Location – Search with events at certain locations
Event type – Search with event types (move, create, …)
Event since / until – Limit the search by date and time by choosing the time limits on the event since and event until
The columns on the search results are:
EPC – EPC code of the item
External ID – External ID (optional) of the item
GS1 EPC presents the EPC code parsed to urn:epc:tag format, if parsing the EPC is possible (i.e. if the tag is encoded in GS1 standard)
*,? wildcards are supported
Event type – Event type of the event
Event time – Time when the event was created
Server timestamp – Time when the event was received by the server. This time may differ from event time if the client applications buffer events (or in the unfortunate case if the clocks of the server and the device differ).
Location – Location of the event
Info – Optional information that can be included with each event
User – User who has created the event
The Shipment events view can be opened from the black top bar under History -> Shipment events. Similarly to Asset events view, the Shipment events view contains a search engine for events – for events relating to shipments.
Shipment events view shows events related to any shipments.Shipments are collections of assets, 0-N pcs, that can be tracked. Shipments tracking allow tracking of a group of multiple assets in one shipment.
The search criteria contains:
Shipment ID – Unique shipment ID
Event type – Choose the desired event type from the dropdown menu
Events since / until - Limit the search by date and time (of when the device was created) by choosing the time limits on the last event since and last event until
Server events since / until - Limit the search by date and time (of when the event was received at server) by choosing the time limits on the last event since and last event until
Location – Location of the event
The Message Manager can be opened from the black top bar under History -> Message Manager. The message manager component is used to view, edit and resend integration messages.
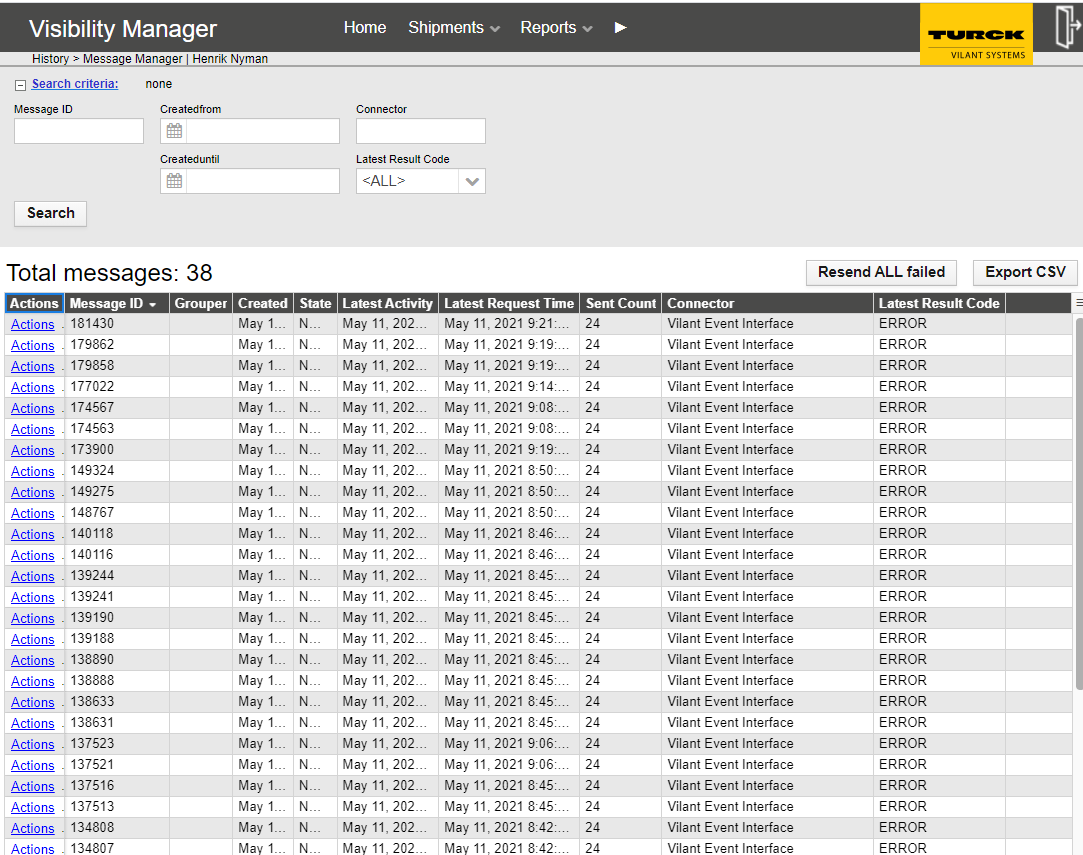
You may filter and search the messages with the following criteria:
Message ID
Time window
Connector
Latest results code – Filter the results by the latest results code. E.g. you may want to filter all messages that have the latest code “ERROR” to display all messages with errors.
The table shows all messages that have been entered to the message queue. The columns are described as:
Message ID – Unique identifier for the message
Created – time of creation of the message
State – shows message delivery status
Latest activity – Latest time of any activity related to message sending (e.g. sending request / response)
Latest request time – Latest time when the message sending attempt has been made.
Sent count – displays how many times the message has been sent
Connector – Endpoint connector name
Latest result code – the result code of the latest sending of the message
Action:
(Note that if you edit an failed message, you probably want to send it. Use send action.)
Show sending attempts list
(re)send message
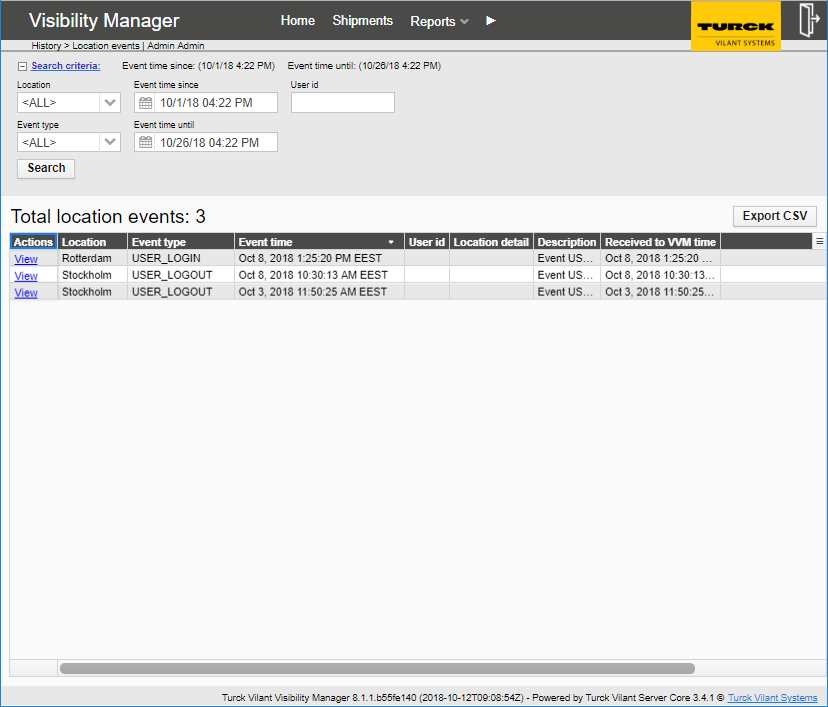
Location events report lists events that are related to a location (rather than an asset). Events are of typically type “user has logged in to location” / “user has been logged out of location”.
Physical inventory reports can be also seen in the location events report (event type: INVENTORIED) including information of who (username) and when (timestamps) inventory was completed
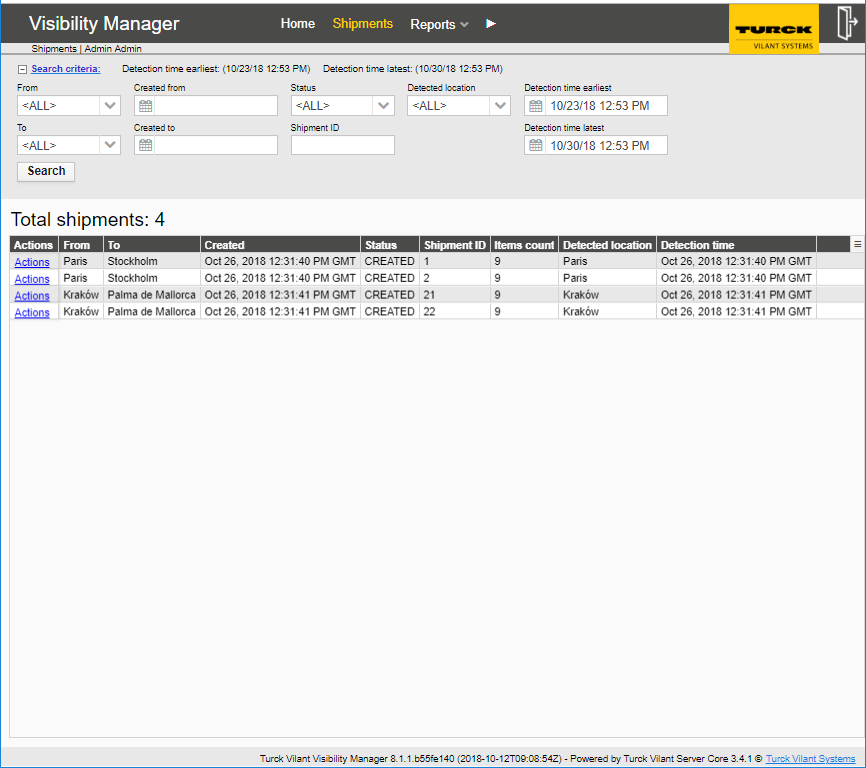
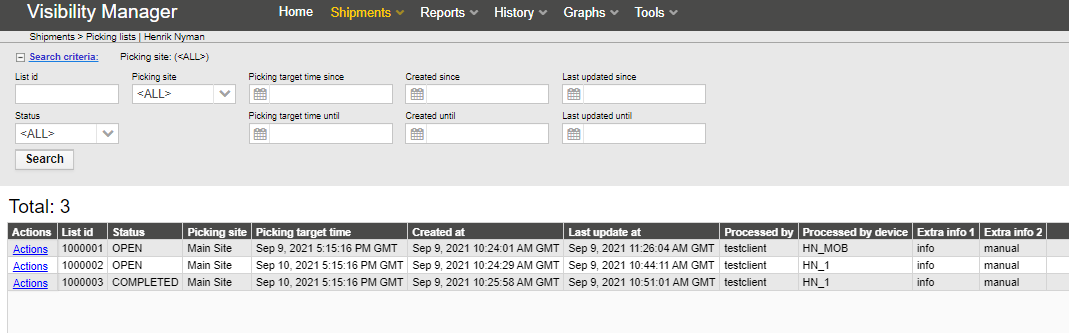
The Shipment overview can be opened from the black top bar under Shipment
Figure 18 - Shipment
Shipment overview provides list of shipments created in Vilant Visibility Manager. Shipments can be created using client/engine use cases for ’shipment creation’.
A shipment in Vilant Visibility Manager is a batch of assets and shipment tags, going generally in same destination. A shipment tag can be specified for a handling unit in which the other assets of the shipment are tied to. (Example of this could be a pallet and boxes on it.)
It should be noted that the “shipment” might not necessarily mean 1:1 shipment in e.g. SAP (entity which has e.g. its own waybill). Rather – depending on the project use case, a shipment may be used to refer to e.g. one pallet and its boxes to batch of several pallets going to same destination (Gate, truck or customer, gate) up to a larger batch of pallets spanning over e.g. several trucks.
Shipments (from the Shipments menu) report can be used to track shipments and their status. The Search fields allow searching results with shipment IDs,status, locations or a date and a time window.
Active shipments have status open or closed. Inactive status means, that shipment cannot be used anymore in tracking, it is only visible in reports as historical data.
New assets can be only added to open shipments. Closed shipments content cannot change.
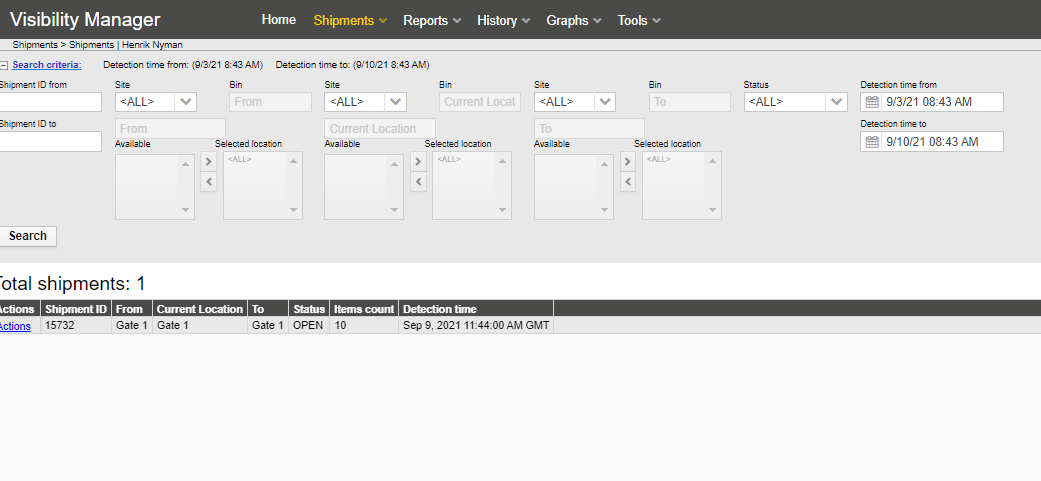
The search criteria contains:
From – Location where it was shipped from
To – Location where it was shipped to
Last event since / until – Limit the search by date and time by choosing the time limits on the last event since and last event until
The search results table has the following columns:
From – Where the shipment was shipped from
Created – Timestamp when the shipment was created
Status – Status of the shipment
EPC – EPC code of the item
Shipment ID – ID number for the shipment
Items count – number of items the shipment contains
Detected location – Current location of the shipment
Detection time – When the shipment was detected at the location
The contents of a shipment can be seen via the Actions link.
The chosen shipment ID is displayed at the top bar of the shipment contents pop-up. The main field contains the shipment contents. The table has the following columns:
EPC – EPC code of the item
External ID – External ID (optional) of the item
Location – Current location of the shipment
Type – Item type
Last event time – Last event for the item
Figure 21 – Shipment contents
Each shipment’s events can be seen via its Actions link.
Figure 22 – Shipment events
Orders report (from the Shipments menu) is used to track status of order operations. The report shows open and completed orders.
An order is used to communicate product types (or specific assets) needed to retrieve from inventory storage location and their quantities and target locations (such as outbound area) in order to fulfill orders (no tracking in TVVM, orders are tracked in other systems where TVVM is integrated to).
An order contains a list of product types (+optional EPC/EID codes to pick) and quantities to pick, bin location and status, link to asset events and to assets.
Orders can have status: Open, In progress, Partially completed, Completed and Inactive.
By choosing Tools menu from the top bar, the user is able to access tools for user and system maintenance and configuration.
Figure 24 – Tools
Users are managed under the user profiles menu item. Typically, this view is visible only to the administrator of the system.
The main view displays current status of users with their permissions. The columns in the user listing are the following:
Username – username for the user
First name – First name of the user
Last name – Last name of the user
E-mail address – E-Mail address used for alerts notification
Company – the company of the user (if such has been set)
User Groups – Lists the permissions granted for the user. For more details, refer to section 0.
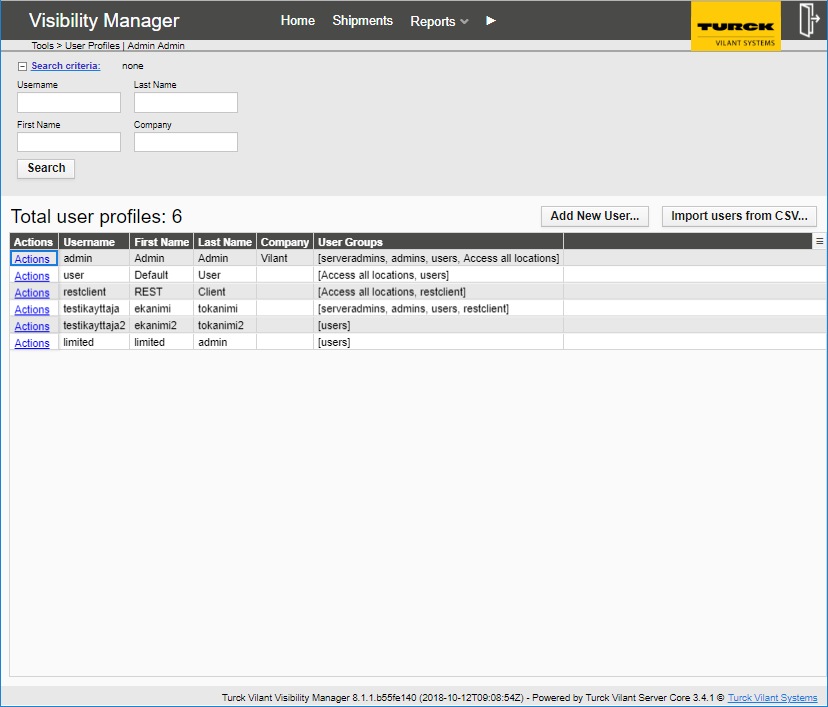
New users can be added from “Add new user…” button.
It is also possible to mass import users through a CSV import.
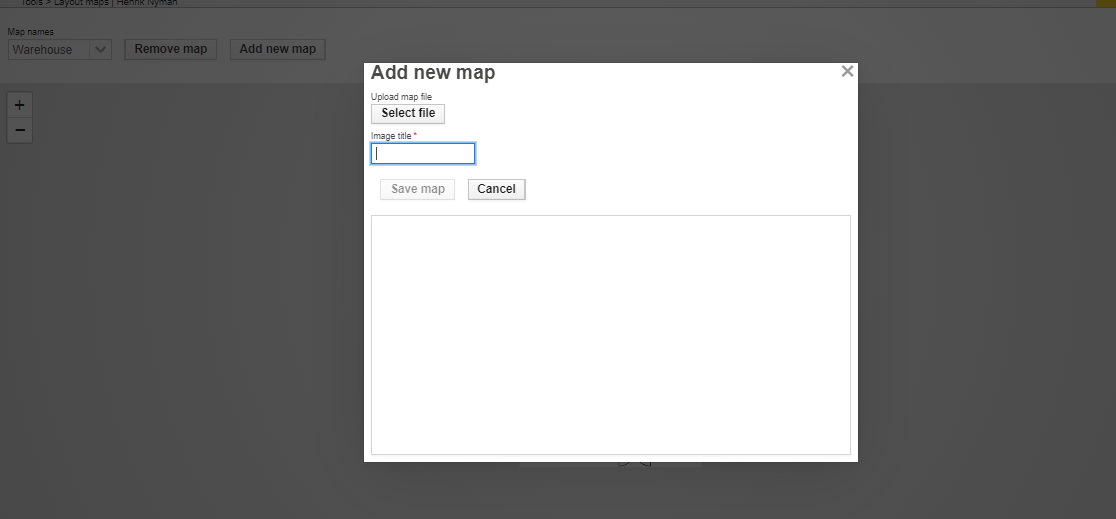
New layout maps can be loaded in to VVM using the upload functionality. Give a name for the new layout map file and upload corresponding image file (such as jpg, png).
Use locations page in Tools menu to add new Sites, Locations and bins to the system.
Definition of location hierarchy levels.
->ite (Highest level, required at least to have 1 site in system)
->BIN (optional)
Site is always required and unique (even if null as site, null is considered one “site”, for backwards compatibility). Asset is always in some location, bin is optional extra information. Location is always part of a site (even if null as site) and must be globally unique. Bin is always part of a location and should be also unique. Combination of site + location + bin must always be unique.
Tag EPC codes can be used to mark locations or bins to create so called floor tags or location tags. Also bin can be configured to have an EPC code (bin tag).
Add new locations from buttons Add site, add location and add bin.
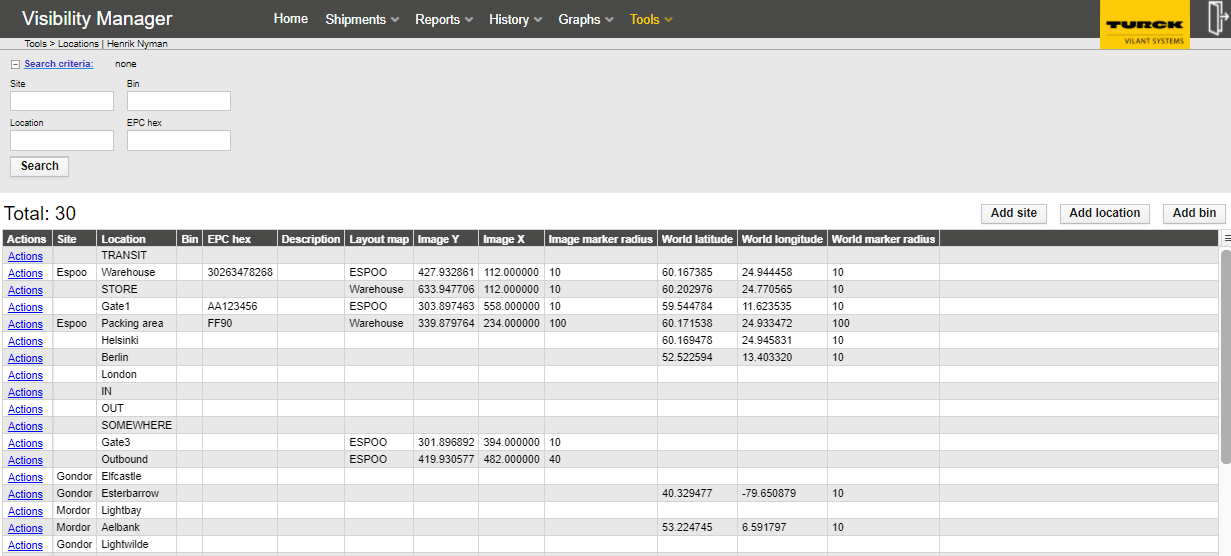
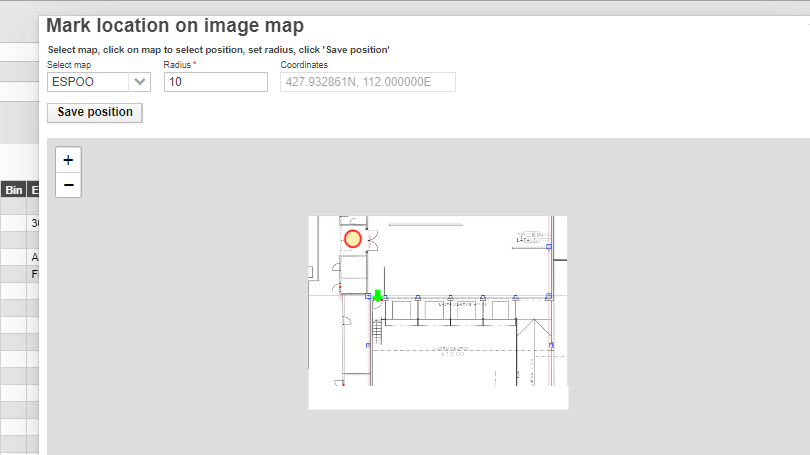
Coordinates for layout maps are defined for each location from actions menu (mark location on image map)

Select a loaded layout map file first and then click on desired location on the layout map shown in popup to select coordinates for the location.
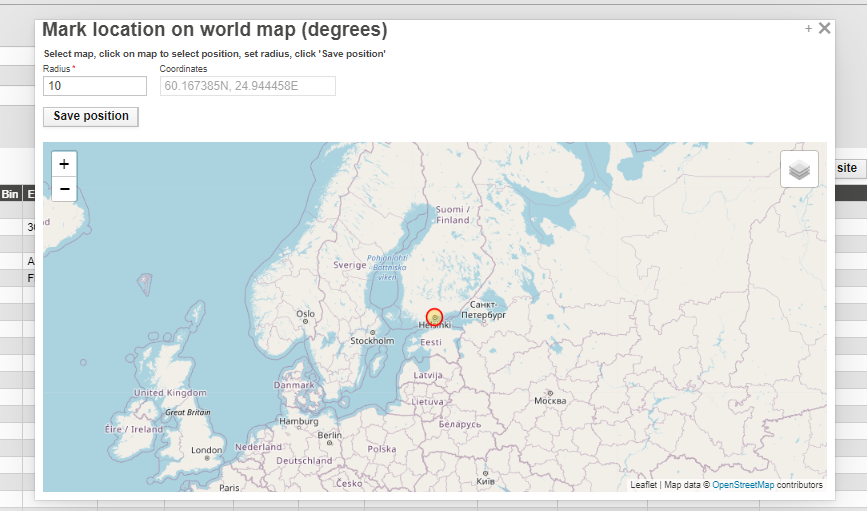
World map coordinates can be assigned to locations in the same way, by clicking a position on the popup world map and saving position.
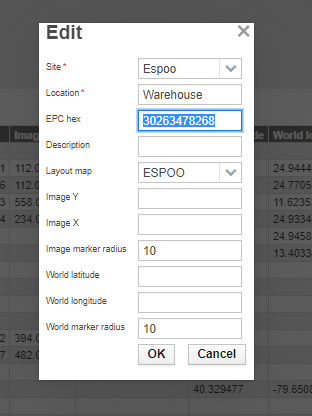
Actions – Edit manu can be used to define location details, such as EPC code for he location tags.
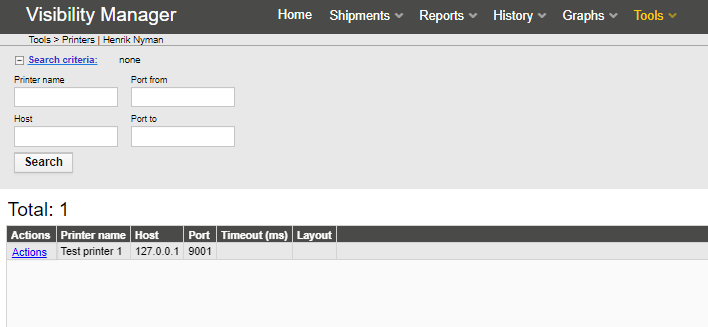
Printers can be configured in the Tools -> Printers page. Multiple printers can be created in the system each having defined: a name, host (ip address), port (tcp port), a timeout value for the connection timeout and a layout text. The layout text field is used to send the layout of the printing to the printer. It can be for example Zebra ZPL language or similar. Each printer can have their own layout file defined.
The variables that can be used in the layout text files are:
#TYPEID#
#SIZE#
#NAME#
#PRICE#
#QUANTITY#
#QUANTITYUNIT#
#STATE#
#LOANABILITY#
#ITEMREFERENCE#
#EPC#
#PHYSICALID#
#EXTERNALID#
#GS1ID#
#LOCATION#
#STATUS#
#TYPE#
These variables will be exchanged in the actual data sent to printer according to the asset/product type selected for printing.
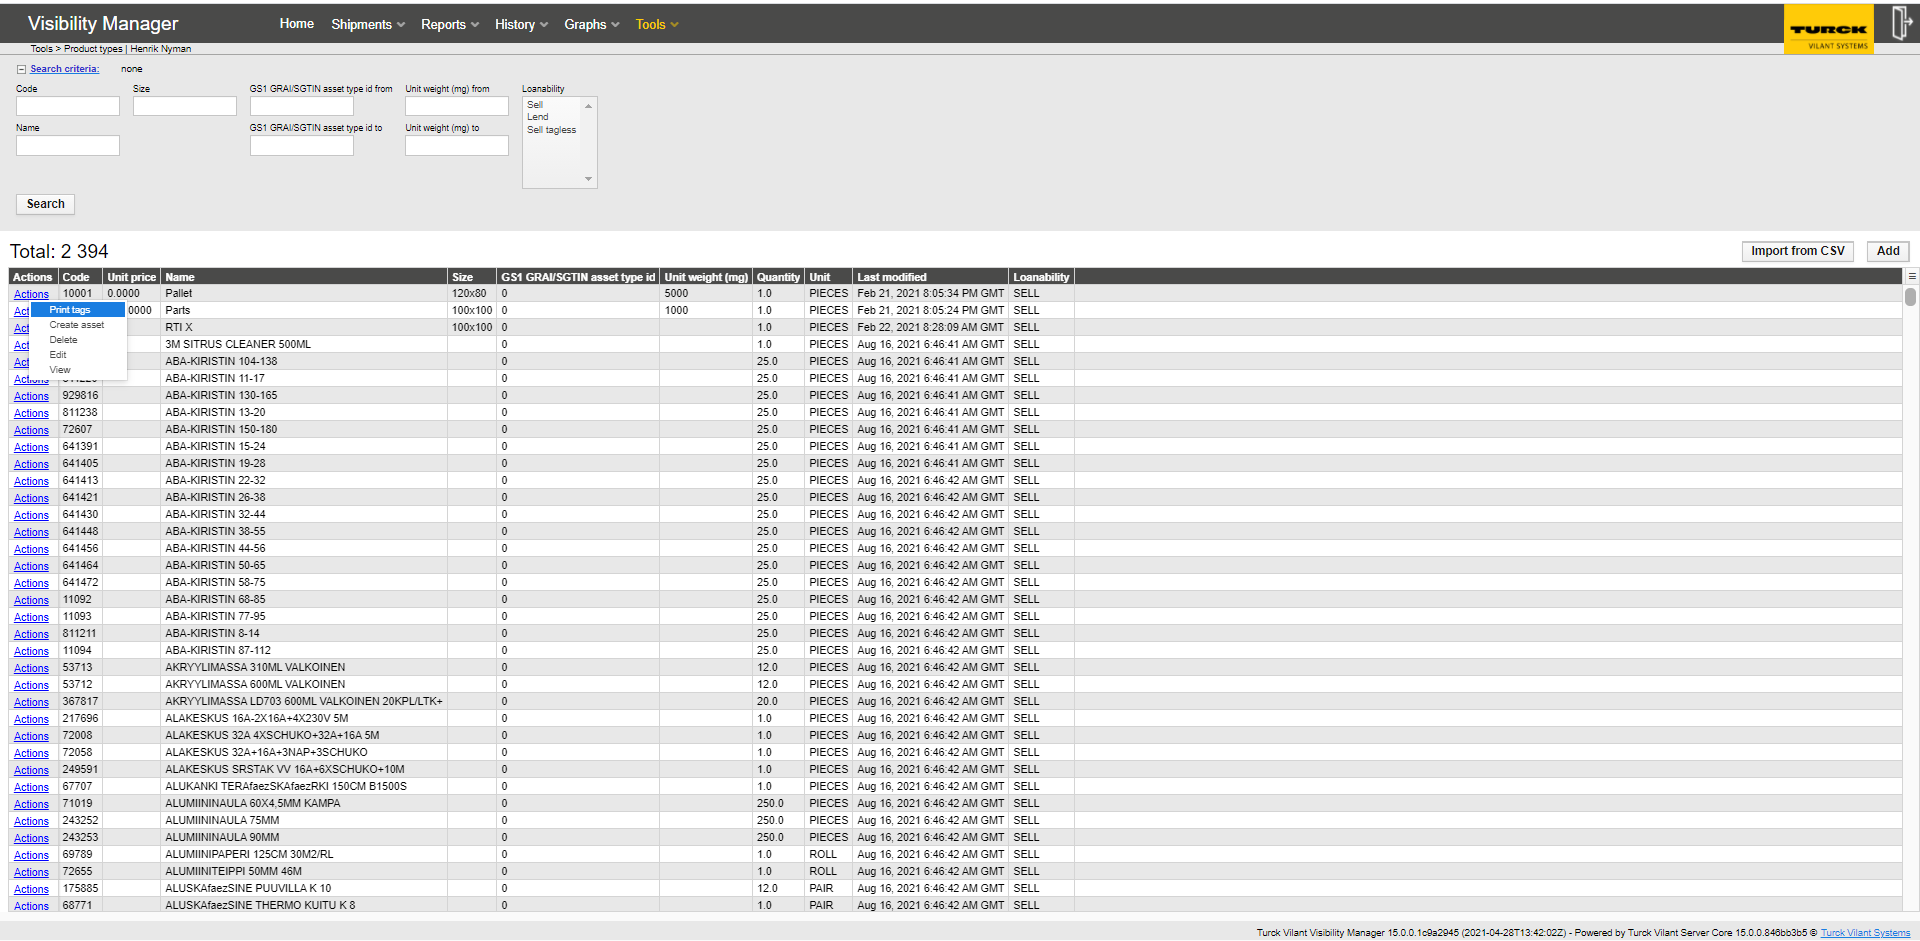
Printing of actual new labels can be triggered form the Tools-> Product types page, by selecting a product type -> Actions -> Print tags and printing N number of new labels for the product type and selecting a printer from the list. In this case N number of new assets is created to the system.
This requires admin level user priviledge to access the Tools menu.
Printing can be triggered also from the Reports -> Assets report page, by selecting an existing asset and printing labels for it. In this case the asset will remain the same and only a label with data form asset is printed.
Printing can be also trigged from an external system by using the REST interfaces provided.
The integration endpoints functionality is used to list, manage and edit integration endpoints.
The table contains the following columns:

Name – name of the integration endpoint
Enabled – shows if the endpoint is enabled or not
Username - shows username used for the endpoint if applicable
Password – shows password used for the endpoint if applicable
Additional params – Additional parameters that an (customized) integration endpoint may have.
Max attempts – Defines the maximum number of attempts of resending a failed message
Interval – Defines the interval between resending of failed messages (For the first resending.)
Interval multiplier – Multiply the interval by this value after the first attempt. (Can be used to alleviate problems of longer downtimes.)
Typical values:
1.0 - Do not use exponentially slowing resending
1.5 – Slow exponential slowing (makes sense if you allow > 10 resending attempts)
2.0 – Rapidly slowing resending
Connector – exact software identity of the connector implementation
Endpoint URL – shows the URL used for the endpoint
Actions – Editing (or viewing) the connector endpoint
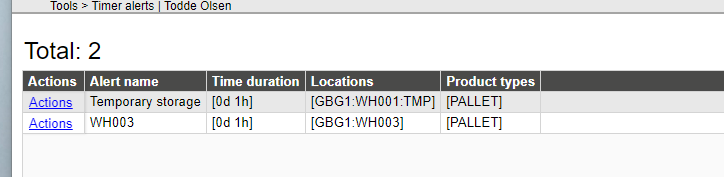
*Timer alerts are configured with:
Alert name - Unique name
Time duration – time that an asset can be in the location before giving the alarm.
Locations – Location/Locations that shall be monitored.
Product types – Product type/types that shall be monitored.
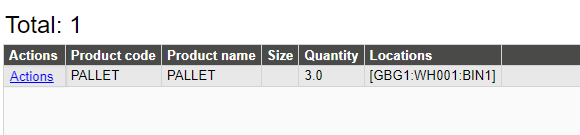
Inventory alerts are configured with:
Product code – Product type to monitor
Quantity – Below which quantity to give an alarm
Locations – Locations to monitor
A subscription for inventory and timer alerts can be configured for users with e-mail address configured.
Subscription type – All locations or specified locations
Description – Informative description
Receipient users – Users that shall receive mails
Vilant Visibility Manager provides an highly flexible ”one-level” user permission management suitable for medium amount (5-100) of users working as follows.
Each user has a list of permissions (“access rights”) to different user interfaces as well as locations in which the assets and event data is related to. If the user has been given permission for “user management”, (s)he may create new users. When giving permissions to the other users, it is not possible to give more permissions than the original user has (less is possible). (Naturally, the “root user” (admin) has rights to all possible permissions, including server settings.)
This structure makes it possible to build group of “medium level administrators”, who are able to manage users in their domain. For instance, in a multi-(customer)company multi-site installation, the “root” administrator (running Vilant Visibility Manager) may create “Medium level administrators” for each (customer) company. The “medium level administrators” may have access rights to the locations of their own company as well as the user management. The “medium level” administrator of the individual company may then create new users for personnel of their company, who could e.g. have access rights only to their individual sites, freeing the “root” administrator from the need to create all new users.
To put the TVVM “one-level” user permission management into context, it should be noted that the configurability of the system is in the middle between “hierarchical” user management (rigid, almost nonconfigurable) with hard-coded permissions for different user levels (e.g. super users (“admins”) vs. users) or “2-level-configuration” permission management in which where individual permissions are first mapped (configured) to different user levels and the different users are thereafter given different user levels (highly flexible, but requires significant configuration work.)
A user profile must contain at least:
Username and password
First and last name
User group (Admin, User, Access all locations)
The “Access all locations” grant permission to see assets at any of the locations in the system. Each user can be restricted to only see and manage assets at certain locations.
SSO can be supported as customized projects, mainly the OAUTH standard. Only sign in functionality is supported. The user credentials in the authorization system must also be manually created in the TVVM.
TVVM provides mechanisms to import users, companies, cost centers and product types using CSV files. For each of these, there is an Import CSV button in the TVVM web UI. After clicking the button, a dialog opens and allows user to select the CSV file from user’s disk.
The technical details of the CSV file format are:
| Character encoding | UTF-8 |
|---|---|
| Column separator | Semi-colon (;) |
| End of line | Line feed (LF) |
The exact format of each CSV file and other details are described in the following sections and in each CSV import dialog.
CSV import is based on the header line of the CSV file. The supported headers are documented in the CSV import UI.
If a user with the same ID is already in the system, it is ignored. (We prevent overwriting existing credentials which can make the system dead.)
If a company of new user does not exist, it would be created.
CSV import is based on column positions. The CSV file should not have header line. The data should have the following columns:
Company Code;Company Name
All existing companies with the same number will be updated during the import.
CSV import is based on column positions. The CSV file should not have header line. The data should have the following columns:
Company Code;Cost Center Code;Cost Center Name
All cost centers updated via REST interfaces delete previous values and the new ones are replacing all old values.
If a company for a cost center is not found, those cost centers are ignored.
CSV import is based on the header line of the CSV file. The supported headers are documented in the CSV import UI.
If a product type with the same Code already exists in the system it is overwritten.
The supported quantity units are documented in the UI.
TVVM supports RFID device connectivity for the following devices
(using the „asset inbound HTTPS interface“)
:
All devices running Turck Vilant Systems Client for PC or Handheld
All devices running Turck Vilant systems Engine
Tools -> Report field customization allows hiding unnecessary columns from the different reports as well as changing the title texts of the reports. This can be used to e.g. customize the reports to be usable in a specific customer case – or e.g. for translating the user interface.
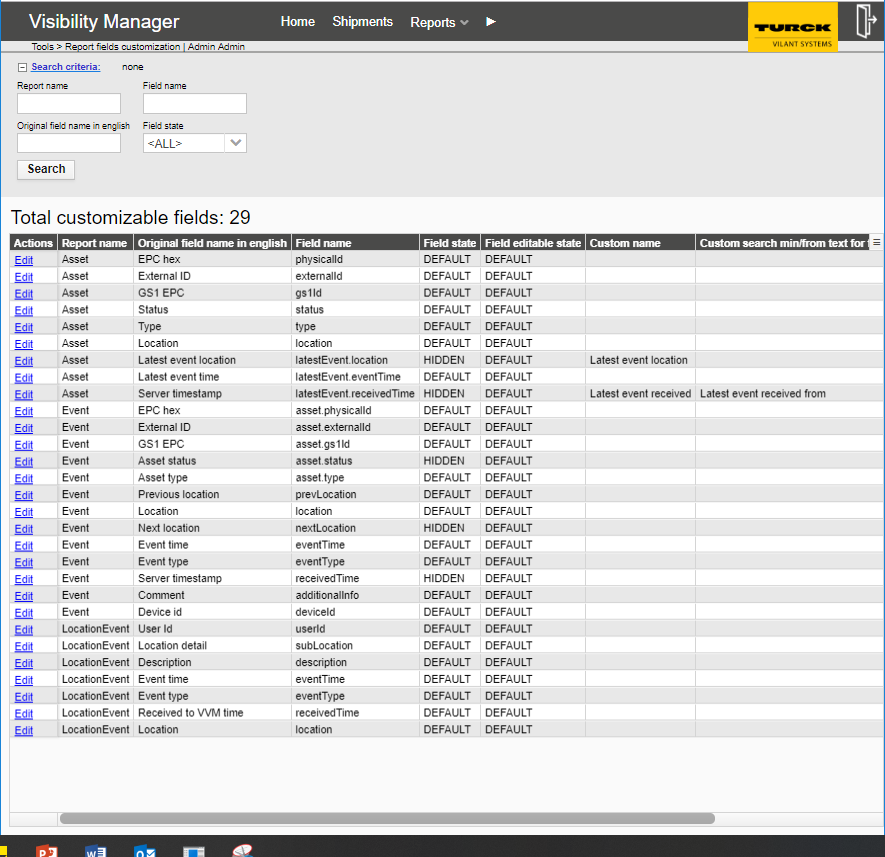
Field editable state:
Defines whether the data can be edited via Actions -> Edit.
(In many cases the fields should be set to Not editable (e.g. “Last event time.)
Field name:
the (modified) field title.
Field state defines the column title shown in report:
DEFAULT: “Original field name in english”
MODIFIED: “Field name”
HIDDEN: The whole column is hidden from the particular report
Figure 27 – Report fields custimization
This chapter lists the external communication interfaces TVVM contains. Interface specifications are documented separately, please see interface specific documents.
Server health check and healthcheck2 (http servlets) are a static http pages to conduct server health check. Can be used for monitoring the server operability (e.g. from network monitoring tool
Simple healthcheck
HealthCheck
DB connection OK.
Healtcheck 2: advanced healtcheck servlet
Example result
{“name”:“Vilant VM Basic”,“version”:“3.5.0.39866”,“startDate”:“2013-09-20T13:40:38.615Z”,“database”:“OK”,“currentDate”:“2013-09-27T13:16:04.897Z”}
The TVVM has been designed so that it is very cost efficient and quick to deploy customer specific interfaces. These will be managed by the enterprise integration component and will show as additional integration endpoints. The messages of these components shall be shown in the message manager. Adding new (custom) integration endpoints is not possible by end user (this is possible only by contacting Turck Vilant Systems).
This chapter includes instructions for system administrator on how to install TVVM.
Visibility Manager supports application servers and databases as defined in Vilant Software Requirements document. Install the desired application server and database according to the installation instructions provided by its vendor.
Visibility Manager requires Java 8 at a minimum. Use the following Java memory settings and increase the values if necessary:
-Xms256m -Xmx512m -XX:PermSize=128m -XX:MaxPermSize=256m
Ensure that the internal clocks of the RFID readers are synchronized with the Visibility Manager server. Use an NTP server or a similar time synchronization mechanism to ensure reliable operation.
Vilant Visibility Manager requires no daily maintenance.
After installing TVVM you can log in with administrative rights with the following default credentials:
| Username: | admin | |
|---|---|---|
| Password: | v1lant |
This user is also restored if all users are removed from the database.
(The default password may vary if TVVM is generated with autocreator.)
The server settings can be changed from the server settings menu item under the tools tab. Generally, his menu item is only visible to an admin level user.
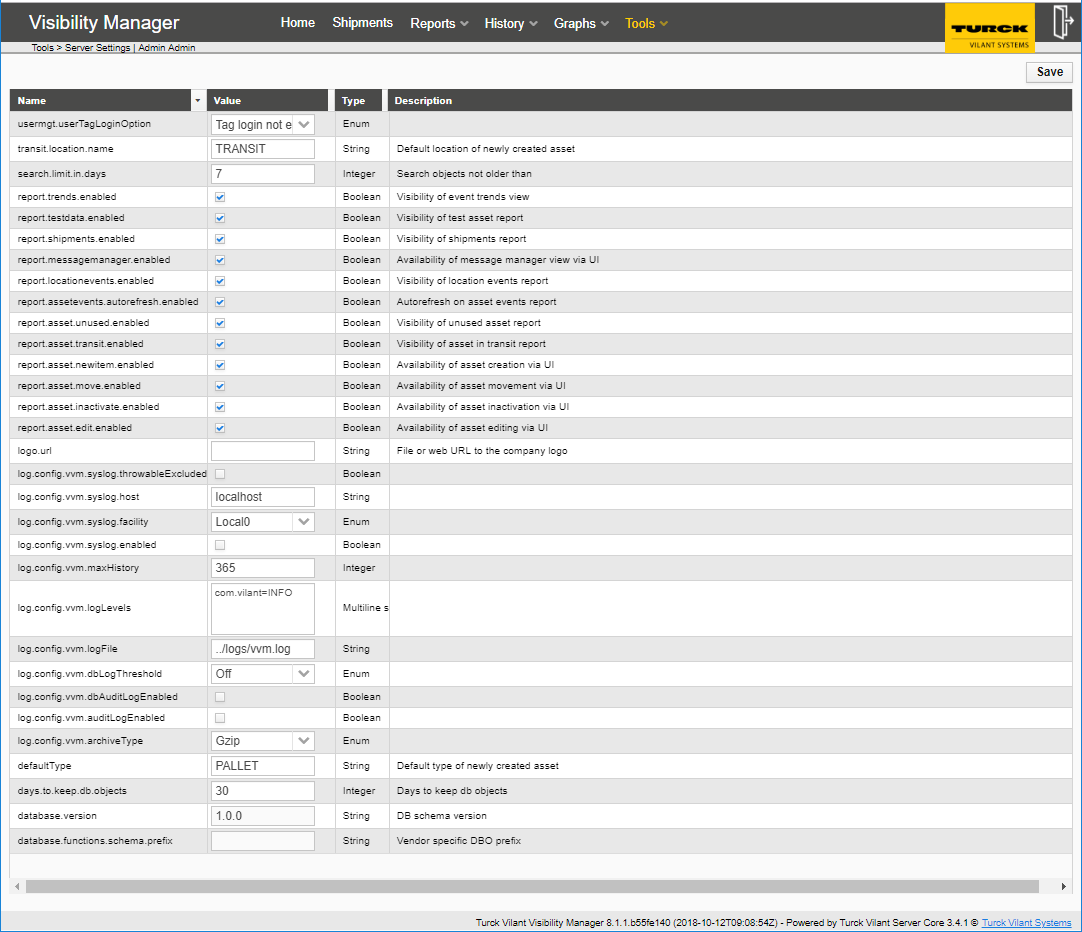
Server logging related settings
URL to optional customer logo
(See upper right corner)
Show or hide the individual report UIs.
It is good idea to untick the unnecessary reports.
Location where the assets are (auto) created
CUSTOMER LOGO